INTRODUCTION
With the launch of Shopify Editions 2025 — codenamed Horizons — the platform has introduced one of its most ambitious updates to date. Packed with powerful tools for merchandising, B2B enhancements, AI-native features, and a stronger emphasis on visual storytelling, this release signals a significant evolution in how merchants build and grow their storefronts.
At the heart of this update are 10 brand new Shopify themes developed by Shopify itself: Horizon, Atelier, Tinker, Heritage, Vessel, Dwell, Savor, Pitch, Ritual, and Fabric. These themes are designed to showcase the latest capabilities of the Online Store 2.0 framework — offering modern layouts, native app integrations, and deeper customization without code.
But while the aesthetics and feature sets are impressive, there's one critical factor that often gets overlooked in the initial hype: performance.
How fast are these new themes really? What do their PageSpeed scores look like right out of the box?
As a company specialized in performance optimization for Shopify — here at Page Speed Group, we wanted to dig into the actual lab metrics. This benchmark is designed to give merchants a clear, data-driven look at how each of the new Horizon themes performs from a speed perspective, so they can make smarter decisions before installing a theme that may affect their conversion rates or user experience.
METHODOLOGY
To ensure objective and repeatable results, this performance benchmark was conducted over a 7-day testing period from June 2 to June 8, 2025. All tests were performed at three fixed intervals per day — 10:00 AM, 4:00 PM, and 10:00 PM (CET, Paris time). At each interval, three consecutive PSI tests were run, and the results were averaged for that segment. The final dataset reflects absolute averages across all sessions.
Testing Environment
- Platform: Shopify themes installed on a clean testing domain (no redirects, no apps)
- Templates Tested: Homepage, Product Page, Collection Page, Blog Listing, Individual Article Page, Custom Plain Text Page
- Theme versions: All themes tested are version 1.0.3.
Mobile Testing Conditions
- Device Emulated: Moto G Power
- Lighthouse Version: 12.6.1
- CPU/Memory Throttling: 1.2x slowdown (simulated)
- Screen Emulation: 412 × 823, DPR: 1.75
- Network Conditions: Slow 4G - 150 ms TCP RTT / 1,638.4 kb/s throughput (simulated)
- User Agent: "Mozilla/5.0 (Linux; Android 11; moto g power (2022)) AppleWebKit/537.36 (KHTML, like Gecko) Chrome/136.0.0.0 Mobile Safari/537.36"
- Browser Engine: HeadlessChromium 136.0.7103.113
Desktop Testing Conditions
- Device Emulated: Desktop Chrome
- Lighthouse Version: 12.6.1
- CPU Throttling: 1x slowdown (simulated)
- Screen Emulation: 1350 × 940, DPR: 1
- Network Conditions: 40 ms TCP RTT - 10,240 kb/s throughput (simulated)
- User Agent: "Mozilla/5.0 (Macintosh; Intel Mac OS X 10_15_7) AppleWebKit/537.36 (KHTML, like Gecko) Chrome/136.0.0.0 Safari/537.36"
- Browser Engine: HeadlessChromium 136.0.7103.113
Template Configuration Details
- All defaults
- No apps installed
- Products images 1000x1000px web optimized JPGs
Important Note: These are lab test results, not Real User Monitoring (RUM) or CrUX field data. Results represent a controlled environment and should be interpreted as such.

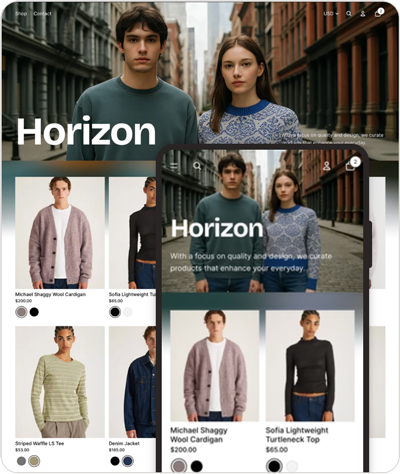
While Horizon visually sets the tone for Shopify’s 2025 Editions collection — clean, open, and modern — its performance tells a more nuanced story. Desktop results are excellent across the board, with consistent 90+ scores and near-instant rendering. However, mobile scores, particularly on content-heavy pages like the Homepage and Article templates, show noticeable delays in Largest Contentful Paint, indicating potential challenges for merchants prioritizing mobile speed.
-
🔴 CRITICAL ISSUES
Large LCP Delays on Mobile
Homepage and Article pages show extremely high Largest Contentful Paint (LCP) times — up to 11 seconds — primarily due to oversized hero images and render-blocking elements. This significantly impacts user experience on slower mobile networks or lower-end devices.
Render-Blocking Resources
CSS and JavaScript often delay first meaningful rendering, especially on mobile. Estimated CSS savings reach 30–40 KiB per page. These critical path resources should be deferred or reduced wherever possible. -
🟠 HIGH-IMPACT OPPORTUNITIES
Image Optimization
Many templates use oversized or improperly compressed images, adding 800 KB to 1 MB of unnecessary weight. Optimizing media assets would directly improve LCP and total load times across all page types.
DOM Complexity
Templates like Homepage and Collection have large DOM trees (950–1,300 elements), increasing parsing time. While not immediately harmful, this becomes more problematic as apps or dynamic content are added. -
🟡 MODERATE CONCERNS
Static Asset Caching
Cache policies for images, scripts, and stylesheets are too short-lived, which hurts repeat load times. Extending cache TTLs can improve perceived speed for returning visitors.
Unused JS & Legacy Warnings
Small amounts of unused JavaScript (~36 KiB) are present but don’t cause measurable blocking. Legacy JS warnings are triggered across pages, though they currently don’t affect performance and can be addressed in future theme updates.

Atelier delivers standout performance on desktop across all templates, often hitting near-perfect scores. Mobile performance, while stable, shows slower Largest Contentful Paint on heavier pages like the Homepage and Article. It’s a sleek theme that prioritizes visual design.
Overall, the default Atelier payload doesn’t demand heavy refinement on lower-powered devices, though targeted LCP optimizations for mobile would elevate its performance.
-
🔴 CRITICAL ISSUES
Heavy DOM Complexity
Every template in Atelier — even lightweight ones like the Custom page — has a very high DOM size, ranging from ~3,400 to 4,350 elements. This level of complexity increases processing overhead and makes the site more sensitive to additional scripts, apps, or interactive content.
Large LCP Elements on Mobile
Pages like Collection, Article, and Homepage display mobile LCP times over 5 seconds, with the Article page reaching 10.6 seconds. This is driven by large hero images and render-blocking resources, impacting first meaningful paint on mobile devices.
Enormous Network Payloads
The Homepage alone serves over 5 MB of assets, with other pages not far behind. These sizes significantly delay loading on mobile, particularly over 3G or on entry-level devices. -
🟠 HIGH-IMPACT OPPORTUNITIES
Image Optimization
Many pages — particularly Homepage and Article — use oversized, uncompressed imagery. Estimated savings per page range from 160 KB up to over 1 MB. Resizing and compressing these assets would have an immediate positive impact on load time and LCP.
Unused CSS & JavaScript
Every page analyzed shows 20–40 KiB of unused CSS and 20–36 KiB of unused JavaScript. While this doesn’t block rendering directly, it adds unnecessary weight and slows down script parsing. Streamlining styles and scripts would boost efficiency.
Render-Blocking Resources
Critical path resources (CSS/JS) are still blocking first paint on several templates. Estimated delays range from 130–500 ms on mobile. These should be deferred, inlined, or split to improve time-to-interactive. -
🟡 MODERATE CONCERNS
Static Asset Caching
Short TTLs were found across key static assets — typically 3 per page. While this doesn’t affect first-time visits, it does reduce speed benefits for returning users. Extending cache lifetimes would make browsing feel faster on repeat.
Legacy JavaScript Warnings
Although legacy JS is detected on all templates, it has no measurable effect on performance. This can be addressed in future theme revisions or ignored for now, as it doesn’t introduce immediate risk.

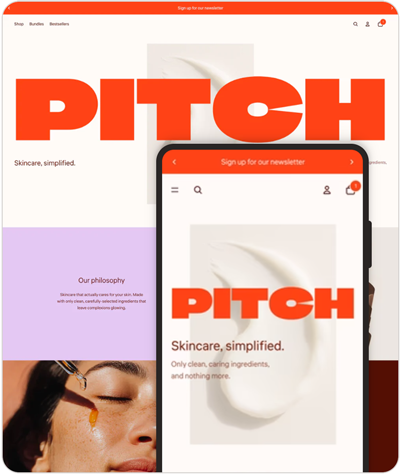
Pitch performs exceptionally well on desktop, with most pages scoring above 90 and minimal layout shift. Mobile performance, however, reveals significant LCP delays — especially on Homepage and Collection pages, where load times exceed 10 seconds.
The theme is visually polished but could benefit from LCP and image optimization work on mobile to ensure content is delivered faster on slower connections.
-
🔴 CRITICAL ISSUES
Severe LCP Delays on Mobile
Pages like the Homepage (13.6 s) and Collection (10.4 s) suffer from major Largest Contentful Paint delays. Heavy hero images, late-loading assets, and a lack of preloading contribute to long waits before key content is rendered.
Excessive Image Payloads
Default imagery is significantly oversized—some pages serve 3–5 MB payloads, especially on Homepage and Product templates. This affects both performance and mobile data efficiency, requiring compression and resizing. -
🟠 HIGH-IMPACT OPPORTUNITIES
Render-Blocking Resources
Mobile LCP is impacted by blocking CSS and scripts. Estimated delays range from 250–770 ms per page. Preloading key images can shave off another 100–400 ms, particularly on Article and Collection pages.
Unused Code and Offscreen Images
Pages carry 20–40 KiB of unused JavaScript and CSS. Additionally, several templates (e.g. Product) would benefit from deferring offscreen images to improve perceived speed.
DOM Complexity
All pages exhibit high DOM counts—ranging from 3,400 to 4,300 elements—which increases parsing time and could cause instability as additional apps or content are layered in. -
🟡 MODERATE CONCERNS
Caching Strategy
Static assets often have short cache lifetimes (1–3 resources per page), which doesn't hurt first loads but slows down return visits. Extending TTLs will improve repeat performance.
Legacy JavaScript
Modern browsers are served legacy JS across all pages, but no immediate performance degradation was observed. While not urgent, this should be addressed in future theme updates.

Ritual balances form and function with strong desktop scores across all pages—100 on Collection, Blog, and Custom.
Mobile performance is decent but LCP issues on key pages like Homepage (6.3s) and Article (6.0s) hold it back.
Fast FCP, minimal layout shift, and low blocking times suggest the theme is stable and polished, but needs image and LCP optimization to fully shine.
-
🔴 CRITICAL ISSUES
Slow LCP on Key Pages
The Product (5.7 s) and Article (5 s) pages including Homepage (6.3 s) on mobile experience severe LCP delays, making them feel sluggish. This is caused by unoptimized images, render-blocking assets, and missing preload tags for key content.
Heavy, Offscreen, and Oversized Images
Many images—particularly on the Homepage and Article pages—are improperly sized or loaded before they're needed, wasting bandwidth. Deferred loading and resizing could save up to 900+ KiB per page. -
🟠 HIGH-IMPACT OPPORTUNITIES
Render-Blocking Resources
Multiple pages suffer from CSS and JS that block rendering, especially on mobile. These delays range from 120–480 ms and significantly impact perceived performance, especially on Blogs and Product pages.
Excessive DOM Complexity
DOM trees consistently exceed 3,300–4,200 nodes across all pages. This bloats rendering time and could create issues when scaling with third-party apps or dynamic content.
Unloaded Preload Candidates
Key images (especially on Article and Homepage) are not preloaded, adding 110–290 ms of delay to LCP. Prioritizing these assets will noticeably improve user-perceived speed. -
🟡 MODERATE CONCERNS
Unused Code
Pages ship with 20–40 KiB of unused CSS/JS. While not massive, this adds overhead on mobile and should be stripped out during bundling or lazy-loaded where appropriate.
Caching Policy
Static assets (2–5 per page) lack efficient caching headers, reducing repeat-visit speed. Assigning longer TTLs will help improve return user experience.
Legacy JavaScript
All pages serve legacy JS, even on modern browsers. While it doesn’t currently degrade performance, removing it will shrink bundle sizes and simplify parsing.

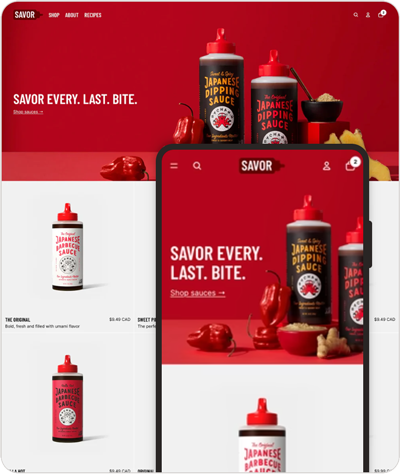
Savor delivers strong desktop performance—91+ on most pages, peaking at 100 for Blog.
Mobile, however, suffers from sluggish Largest Contentful Paint scores, especially on Homepage (10.3s) and Collection (10.9s).
While layout shift and blocking time are minimal, LCP optimization is critical to improve mobile UX and bring overall scores in line with its otherwise polished performance.
-
🔴 CRITICAL ISSUES
Slow LCP on Key Pages
The Homepage (10.3 s), Collection (10.9 s), and Article (9 s) pages on mobile suffer from severe LCP delays. These are driven by oversized hero images, missing preload directives, and render-blocking assets—all of which combine to delay meaningful content from appearing.
Heavy, Offscreen, and Oversized Images
Images on the Homepage, Collection, and Article pages are improperly sized, loaded too early, or never optimized. Combined, they waste over 1.5 MB per page, harming load speed and bandwidth efficiency, especially on mobile connections. -
🟠 HIGH-IMPACT OPPORTUNITIES
Render-Blocking Resources
Mobile performance is especially hampered by render-blocking CSS/JS on the Collection (510 ms), Blog (780 ms), and Homepage (280 ms). Eliminating or deferring these will lead to substantial LCP and FCP gains.
Unloaded Preload Candidates
Across Homepage, Article, and Collection pages, LCP images are not being preloaded, costing an extra 110–150 ms in visual delay. Prioritizing these assets will help content render faster above the fold.
Excessive DOM Complexity
The Collection page alone carries 1,386 DOM elements, with other pages not far behind. This increases the browser's processing workload and makes pages slower to render and update dynamically. -
🟡 MODERATE CONCERNS
Unused Code
All pages ship 20–41 KiB of unused CSS and JavaScript. While not individually dramatic, this unused code creates avoidable bloat—especially on first load for mobile users.
Caching Policy
3–6 static assets per page lack optimized caching headers. Adding long-term caching for these assets will significantly improve return visit performance.
Legacy JavaScript
Legacy JS is still being served to modern browsers on all pages. While it doesn’t currently cause performance loss, eliminating it would reduce parsing overhead and slim down the bundles.

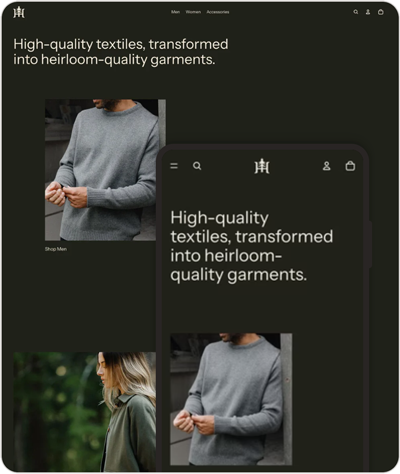
Heritage performs exceptionally well on desktop, with scores between 93–100 across all pages, fast LCPs (as low as 0.6s), and zero layout shift.
Mobile, however, reveals bottlenecks: Homepage and Article pages suffer from extremely high LCPs (10.1s and 10.4s), dragging down performance scores to the high 60s.
While CLS and blocking time remain negligible, improving mobile LCP is essential to elevate user experience and parity across devices.
-
🔴 CRITICAL ISSUES
Large LCP Delays on Mobile
Homepage and Article pages suffer from extremely slow Largest Contentful Paint (over 10s), driven by unoptimized hero imagery and delayed rendering of key visual elements.
Excessive DOM Complexity
Collection pages have bloated DOM structures (1,386+ elements), contributing to slower parse times and rendering, especially on mobile devices.
Heavy Page Weight
Across key pages, image assets are oversized (e.g. 1,400 KiB+ on homepage), pushing total network payloads above 3 MB and dragging mobile performance. -
🟠 HIGH-IMPACT OPPORTUNITIES
Image Optimization
Hero and featured images are not properly sized or compressed. Preloading the LCP image would shave off significant paint delays on both mobile and desktop.
Unused CSS & JavaScript
All templates contain 20–40 KiB of unused CSS/JS. Eliminating or deferring them would improve load speed and reduce script execution overhead.
Static Asset Caching
Scripts, fonts, and images are served with short cache lifetimes. Extending cache headers would improve repeat load performance, especially on slower connections. -
🟡 MODERATE CONCERNS
Render-Blocking Resources
On mobile, multiple CSS files delay rendering. Homepage, Blog, and Article pages show combined delays of up to 700 ms before first paint.
Legacy JavaScript Delivery
Although not severe, legacy JS is being delivered to modern browsers unnecessarily — offers zero savings, but adds complexity.
Custom Page Efficiency
The Custom (simple text) page performs well overall, suggesting potential for simplified templates to dramatically boost mobile scores.

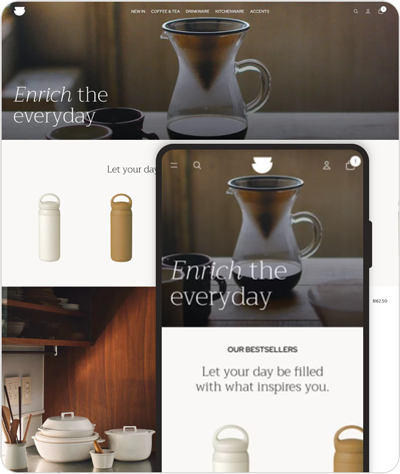
Vessel shows strong desktop performance with fast paint times and near-perfect speed indexes. Mobile performance lags due to high Largest Contentful Paint (LCP) times around 10 seconds on some pages, largely caused by large image payloads and layout shifts.
Total Blocking Time on mobile is higher than ideal, indicating opportunities to optimize JavaScript and resource loading for smoother user experience and faster mobile speeds.
-
🔴 CRITICAL ISSUES
Oversized Images & LCP Delays
Mobile LCP times exceed 10 seconds on key pages (Homepage and Article) due to improperly sized and uncompressed hero images. Preloading the LCP image could reduce these delays significantly.
Large Network Payloads
Total page sizes over 3 MiB on mobile slow down load times and consume excessive bandwidth. -
🟠 HIGH-IMPACT OPPORTUNITIES
Unused CSS & JavaScript
Templates include 20–40 KiB of unused CSS/JS. Removing or deferring these assets will boost load and execution speed.
Cache Policy Optimization
Short cache lifetimes on fonts, scripts, and images reduce repeat visit performance. Extending cache headers would improve speed, especially on slow connections. -
🟡 MODERATE CONCERNS
Render-Blocking CSS
Multiple CSS files delay rendering by up to 700 ms on mobile homepage, blog, and article pages.
Legacy JS Delivery
Legacy JavaScript is delivered unnecessarily to modern browsers, adding extra complexity without measurable savings.
Custom Page Efficiency
Custom pages perform relatively well, suggesting simplified templates could help raise mobile scores further.

Tinker shows excellent desktop performance but suffers from major LCP delays on mobile—over 10 seconds on homepage and article pages.
Large, unoptimized images and long Speed Index scores suggest significant room for improvement.
Unused CSS/JS and render-blocking resources also slow first paint. Streamlining templates and optimizing assets could dramatically lift mobile scores.
-
🔴 CRITICAL ISSUES
Largest Contentful Paint Delays
Mobile LCP consistently exceeds 7–10s on Homepage, Article, Custom, and Product pages, severely affecting user-perceived speed.
Oversized and Unoptimized Images
Image payloads often exceed 1.5 MB per page. Poor sizing and lack of compression are core contributors to slow loads.
Enormous Network Payloads
Total transfer sizes regularly top 3 MB across templates, dragging down performance—especially on mobile. -
🟠 HIGH-IMPACT OPPORTUNITIES
Render-Blocking Resources
Mobile pages (esp. custom and blogs) experience 280–750 ms delays from unoptimized CSS delivery. Consolidation and deferral could yield major gains.
Unused CSS & JavaScript
Each page includes 20–40 KiB of unused CSS and JS. Removing or deferring these can improve execution time and interactivity.
Static Asset Caching
All templates serve static resources (images, fonts, scripts) with short cache lifetimes, limiting speed on repeat visits. -
🟡 MODERATE CONCERNS
Excessive DOM Size
Templates like collection and homepage exceed 1,000 DOM nodes. While not immediately blocking, this impacts rendering and maintainability.
Legacy JavaScript Delivery
All pages deliver legacy JS to modern browsers, adding overhead with no functional benefit.
Preloading Key Assets
LCP images are not preloaded across most pages. Minor preload savings (40–270 ms) are repeatedly left untapped.

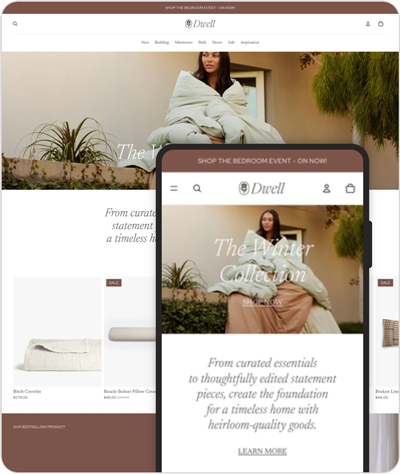
Dwell delivers excellent desktop speed across all templates, but mobile performance lags—especially on Homepage and Product pages, where LCP exceeds 7s.
Key bottlenecks include oversized images, lack of preloading, and minor blocking scripts.
Lighter templates like the custom text page show strong potential for mobile gains through smarter asset delivery and template simplification.
-
🔴 CRITICAL ISSUES
Enormous DOM Size
All page types feature DOM sizes between 3,400–4,300+ elements, significantly exceeding best practices. This inflates memory usage and slows rendering and script execution, especially on mobile devices.
Unoptimized LCP Image Loading
Homepage (10.4 s) and Product page (7.4 s) templates on mobile have LCP values exceeding optimal metrics, heavily impacted by missing image preloads and improperly sized assets. These pages should prioritize visual stability and faster paint times.
Oversized Network Payloads
Most pages exceed 3.5 MB in total payload, driven largely by oversized images and redundant code. Reducing these can yield major performance gains across devices. -
🟠 HIGH-IMPACT OPPORTUNITIES
Image Optimization
Across all templates, improperly sized images result in 800 KiB to 2,000+ KiB of waste. Mobile is hit hardest. Optimizing and compressing images, and deferring offscreen content, would improve LCP and Speed Index metrics.
Unused CSS & JavaScript
Each template includes 20–40 KiB of unused CSS and up to 36 KiB of unused JavaScript. Removing or deferring this bloat will reduce execution overhead and improve interaction readiness.
Static Asset Caching
All page types serve 4–7 static assets with short cache lifetimes. Extending cache policies would significantly benefit repeat visits and improve Time to Interactive on mobile. -
🟡 MODERATE CONCERNS
Render-Blocking Resources
Homepage, Product, and Article templates include render-blocking styles and scripts delaying first paint by up to 500 ms on mobile. These should be inlined, deferred, or split.
Legacy JavaScript
Although the payload is small, legacy JavaScript is still being delivered to modern browsers across all templates, increasing bundle size with no performance benefit.
Custom Page Performance
Despite its simplicity, the Custom page suffers from a 3,500+ DOM size and unused code. With cleanup, it could serve as a high-performance baseline template for mobile-first optimizations.

Fabric offers fast, polished performance on desktop, with near-perfect scores across all templates. Mobile experiences are generally strong, though homepage and article LCPs show room for improvement.
With elegant responsiveness and excellent visual stability, Fabric provides a solid, high-performing foundation for content-rich storefronts.
-
🔴 CRITICAL ISSUES
Largest Contentful Paint
Largest Contentful Paint on mobile is extremely high—Homepage hits 15.6 s and Article at 10.6 s—because oversized LCP images (~2 MB) aren't preloaded. DOM sizes are bloated, with 3.4k–4.3k elements per page, slowing parse and render. Total page payloads also exceed 3.7 MB on mobile. -
🟠 HIGH-IMPACT OPPORTUNITIES
Image Optimization
Hero, featured, and article images are uncompressed and not preloaded—optimizing them can significantly reduce LCP and payload size (~2 MB savings).
Unused CSS & JavaScript
Every template carries 27–41 KiB of unused CSS and ~20 KiB of JS. Stripping these would decrease script execution time and speed up loading.
Static Asset Caching
Multiple static resources lack long-term cache headers. Improving headers will enhance repeat-visit performance, especially on slower mobile connections. -
🟡 MODERATE CONCERNS
Render-Blocking Resources
CSS and JS are delaying First Contentful Paint by 110–600 ms on key templates like Blogs and Homepage. Inlining critical CSS and deferring assets would help.
Legacy JavaScript
Unnecessary legacy JS is served to modern browsers—even if small in size, it adds parsing overhead and maintenance overhead.
Custom Page Template
This nearly static page performs well on mobile (LCP ~3.7 s), suggesting simplified templates are strong mobile performance targets.
The Verdict
This research analyzed ten Shopify themes: Horizon, Atelier, Pitch, Ritual, Savor, Heritage, Vessel, Tinker, Dwell, and Fabric.
It is based based on six key performance metrics: Performance Score, First Contentful Paint (FCP), Largest Contentful Paint (LCP), Total Blocking Time (TBT), Cumulative Layout Shift (CLS), and Speed Index.
Tests covered both mobile and desktop across six page types: Homepage, Product page, Collection page, Blogs, Article page, and Custom page with simple text, providing a clear baseline of out-of-the-box performance.
UNDERSTANDING THE DATA
These results come from controlled lab tests, not field data like RUM or CrUX. While this enables fair comparisons, actual performance will vary based on user behavior, devices, and connection quality. Meeting Core Web Vitals (LCP, CLS, and INP) in real-world usage will depend heavily on these factors.
Further, no theme remains untouched. Installed Apps, added media, and custom layouts—while necessary—will inevitably degrade performance. A high-performing base theme minimizes the burden of optimization and offers a better chance of sustaining speed long-term.
THEME RANKINGS: FASTEST TO SLOWEST
To rank the themes, we aggregated performance metrics across all pages and devices, focusing on three key indicators: Performance Score (a holistic measure of speed and efficiency), LCP (a critical Core Web Vital reflecting main content load time), and Speed Index (a comprehensive gauge of visual rendering speed).
We calculated average values for mobile and desktop, weighted mobile slightly higher due to its dominance in e-commerce traffic, and normalized scores to account for varying max thresholds (e.g., LCP’s differing max values across themes). The rankings below reflect overall performance, with lower LCP, TBT, CLS, and Speed Index values, and higher Performance Scores indicating better performance.
1. Heritage
Top performer overall. Exceptional desktop metrics (Score: 97.17, LCP: 1.12s, Speed Index: 0.73s) and strong mobile results (Score: 73.67, LCP: 6.32s). Low TBT and near-zero CLS across most pages. A strong default choice for speed-focused stores.
2. Atelier
Outstanding desktop (Score: 98, LCP: 0.95s) and good mobile (Score: 73.67, LCP: 6.52s). Near-zero TBT and CLS, though high mobile Homepage LCP (9.6s) and Article page LCP (10.6s) keeps it just shy of the top spot.
3. Tinker
Strong mobile performance on Collection and Blog pages, and excellent desktop stats (Score: 98, LCP: 0.82s). Homepage and Article pages slightly weaker, but overall efficient and lightweight.
4. Ritual
Consistent performer. High desktop scores (Score: 97.67, LCP: 1.2s), solid mobile (Score: 74.33, LCP: 5.22s), very low TBT and perfect CLS on mobile. Smooth user experience across devices.
5. Pitch
Good desktop metrics (Score: 94, LCP: 1.58s), average mobile (Score: 73.83, LCP: 7.18s). Weak Homepage LCP (13.6s) balanced by low TBT and CLS. Works well for simpler store structures.
6. Savor
Strong desktop (Score: 95, LCP: 1.32s), weaker mobile (Score: 72.33, LCP: 7.37s). Mobile CLS and TBT remain low, but high LCP on Homepage and Collection (10s+) limits its mobile readiness.
7. Fabric
Performs well on desktop and some mobile pages, but Homepage mobile LCP (15.6s) is the worst among all. Needs heavy optimization, especially for mobile.
8. Dwell
Great desktop (Score: 96.83, LCP: 1.22s), but lagging mobile (Score: 72.33, LCP: 6.32s). Homepage and Product pages are pain points. Best for desktop-prioritized stores.
9. Vessel
Desktop holds up (Score: 94.67, LCP: 0.95s), but mobile underperforms (LCP: 6.92s), with high Homepage TBT (220ms) and CLS (0.484). Requires optimization for mobile viability.
10. Horizon
Lowest overall. Mobile is particularly weak (Score: 65, LCP: 6.97s,) including idividual result on Homepage (TBT: 800ms). Desktop slightly better but still behind. Needs extensive performance work to be viable.
PERFORMANCE SUMMARY
Heritage, Atelier, and Tinker stand out with high scores, low LCP, minimal TBT, and excellent CLS, making them top choices for stores aiming to meet Core Web Vitals. Ritual and Pitch offer strong alternatives with minor mobile drawbacks.
Themes like Savor, Fabric, Dwell, and Vessel deliver solid desktop performance but suffer on mobile—especially in LCP. Horizon trails far behind, posing significant performance challenges.
Mobile performance is the clearest differentiator, as most themes excel on desktop. Heritage and Tinker often stay near or below the 4.0s LCP "needs improvement" line, while Fabric and Horizon highlight the pitfalls of under-optimized themes.
CLS and TBT metrics add further clarity. Atelier, Ritual, and Savor maintain visual stability (CLS ≈ 0), while Vessel and Horizon show layout instability. TBT remains low across most themes, except for Horizon and Vessel, where interactions lag.
RECOMMENDATIONS FOR SHOPIFY MERCHANTS
- Start with High-Performers: Heritage, Atelier, and Tinker offer the strongest baseline. If other themes suit your branding better, Ritual and Pitch are solid second-tier options.
- Mobile First: Prioritize themes with sub-4s mobile LCP. Test thoroughly after content is added, especially on Homepage and Product pages.
- Minimize App Load: Extra apps slow down your site. Avoid bloat, especially on slower themes like Horizon. Use themes with more performance headroom if app usage is expected.
- Compress Images: Use built-in or external tools to reduce image weight. This is vital for Fabric, Vessel, and others with high mobile LCP.
- Use Lazy Loading & Critical CSS: These techniques improve FCP and LCP. Themes like Tinker and Ritual likely use them effectively.
- Monitor Real Usage: Set up tools like Google PageSpeed Insights early. Lab results are a baseline; real-world data helps you maintain performance as content grows.
- Control CLS & TBT: Reserve space for images to prevent layout shifts, and limit JavaScript-heavy elements to reduce TBT.
- Audit All Page Types: Optimize high-traffic pages first, but don’t overlook Blogs or Articles—they impact SEO and user retention.
- Target Core Web Vitals: Aim for LCP < 2.5s, CLS < 0.1, INP < 200ms. Even top themes need post-launch optimization to stay compliant.
- Book a free discovery call with us. We'll review your current performance, highlight optimization opportunities, and discuss strategies and best solutions. Zero obligation - just pure valuable insights. To book a call please click HERE.
FINAL THOUGHTS
In the relentless world of e-commerce, where speed dictates user satisfaction, search rankings, and revenue, selecting a high-performing Shopify theme is a non-negotiable first step.
While this research illuminates the strengths and weaknesses of ten Shopify themes from the 2025 Horizons Edition, no theme is immune to the realities of real-world usage. Apps, content, and customizations will challenge even the best performers, and lab tests, while insightful, are but a starting point.
By choosing a theme like Heritage or Atelier, you equip your store with a performance edge, minimizing the optimization burden as your business grows. For those drawn to Fabric or Vessel, proactive optimization like image compression, script reduction, and mobile-first design can bridge the gap. Ultimately, this research empowers you to make an informed decision, ensuring your Shopify store starts fast and stays competitive.
In a business where milliseconds literally cost rankings and revenue, fixing all performance issues isn’t just a strategy—it’s an absolute must!